S4A debugging with avr-gdb and simavr
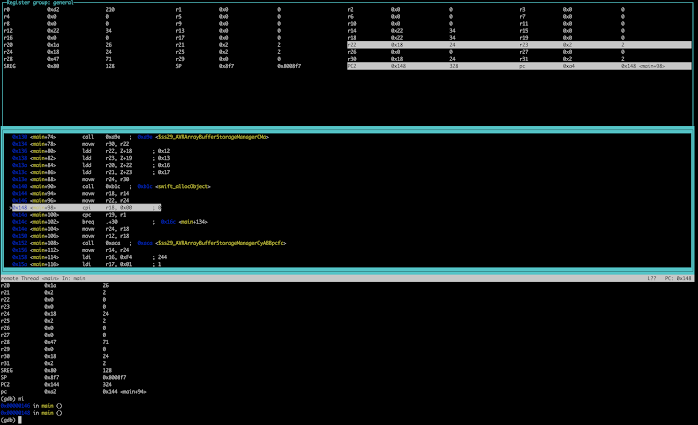
While this has been possible for a while in S4A, with long workarounds, it got a lot easier in the 5.0 beta IDE. Using the "open folder" project structure, save work into a folder and build, the "Terminal" button enables. Press it and you're in a terminal session within the folder, with a command line build ready to go. Run "make simulate-gdb" and you have the program running on simavr, with the debug port open for avr-gdb to attach to. Create a separate Terminal window with the same button for your avr-gdb session and run "avr-gdb main.elf" to pick up the image symbols. In the session choose "target remote :1234" and you're in! My preferred run mode for avr-gdb is "layout asm" or "layout reg" (seen here). Obviously it's not for a beginner, but for an experienced gdb jockey it should prove interesting. Hints You can find these on other blogs about gdb and simavr. But might be useful here. To dump memory.....